
In use in two major inner-city projects in Munich and Zurich.
Scattered project data becomes a model you can interrogate.
What is happening in the ground, what comes next, what does it mean for the project? GeoCubes is software for geotechnical projects: forecast, construction sequence and existing structures in one model – in space, in time and traceable to the source.
Geotechnics Special foundations Infrastructure
The data is there. The connection is missing.
The forecast sits in FEM results, the existing structures in CAD drawings and expert reports, the construction sequence in the schedule, the readings in the monitoring portal. People make the connection: by hand, under time pressure, in spreadsheets nobody can follow later.
GeoCubes brings them together in one model in which forecast, construction state and existing structures fit – and every number leads back to its source.
What we do for your project.
Four questions asked in every project that intervenes in the ground. We answer three today; we are working on the fourth.
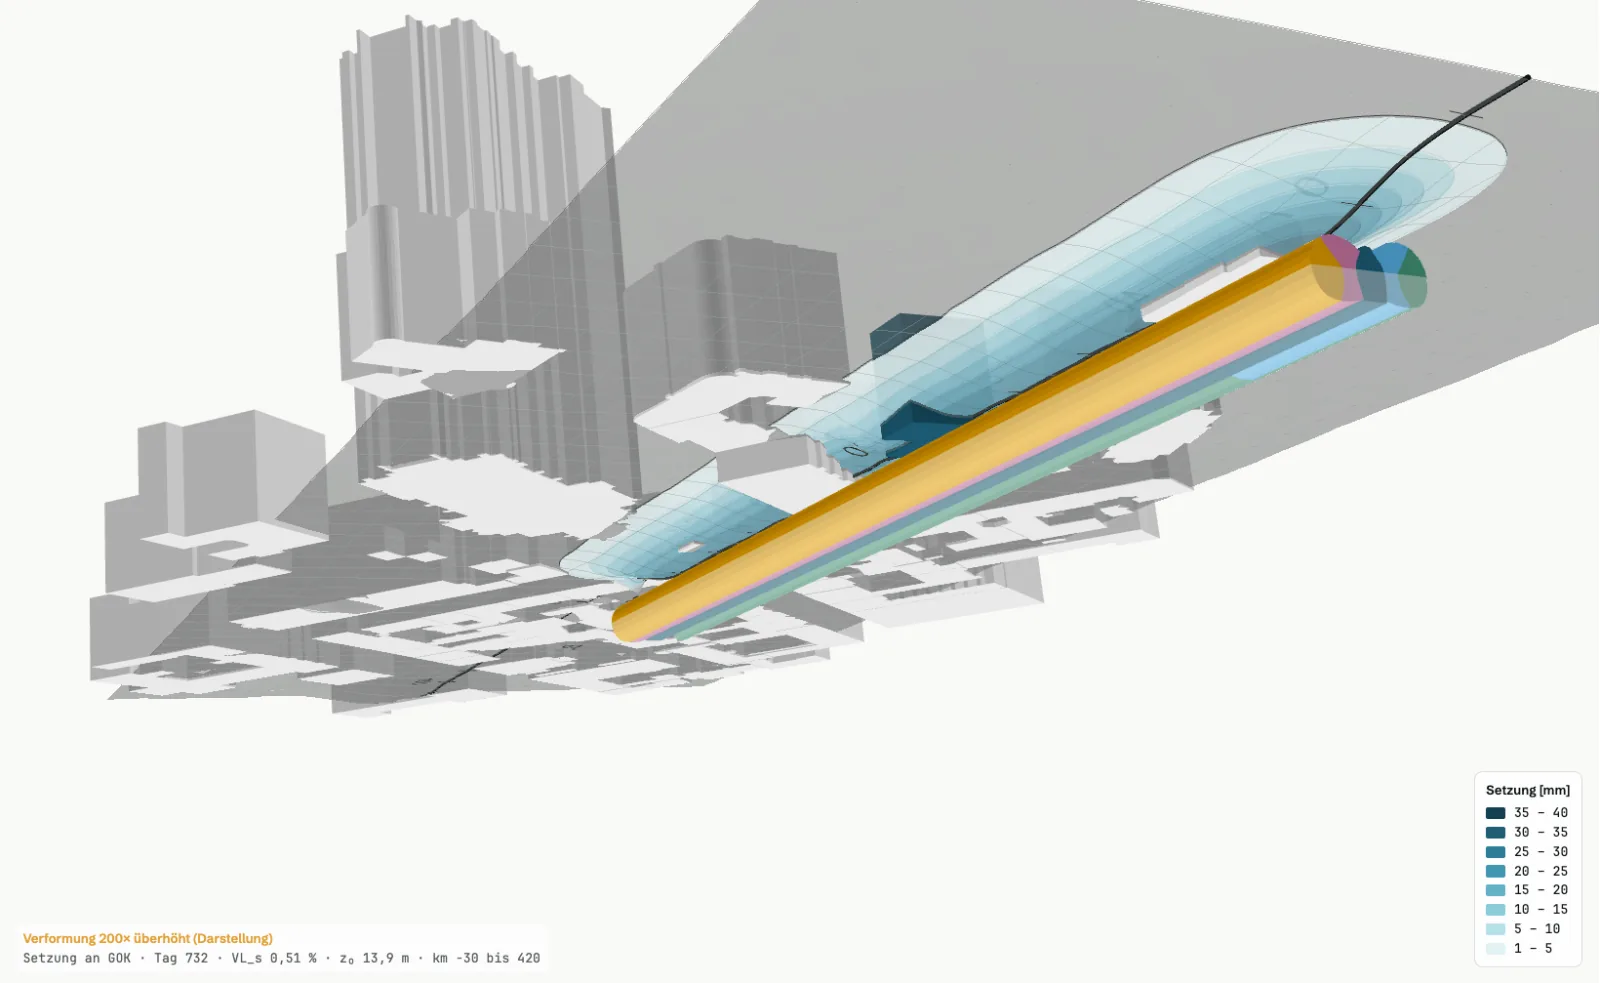
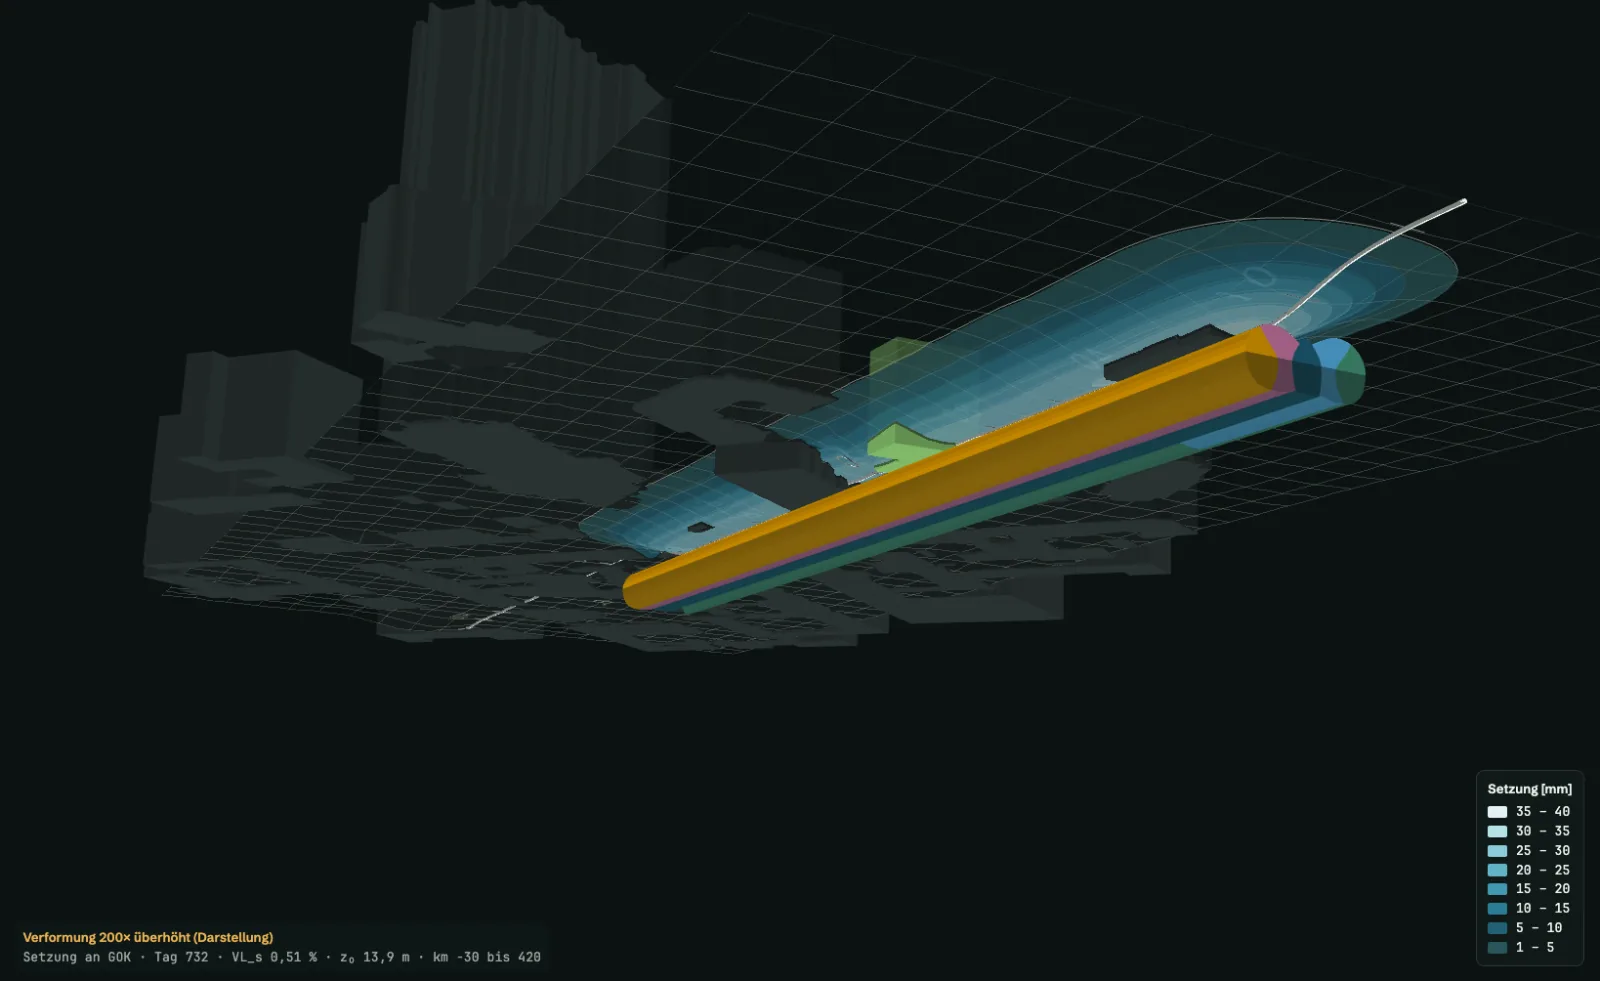
Which ground deformations are to be expected, when and where – and when does it become critical?
FEM results become a spatio-temporal field along the construction sequence: per construction state, per advance, per date. Plan, longitudinal section and time series are views of the same model.
Demo project · synthetic model · days 100 to 600 in time lapse Which buildings are affected, and how severely?
Per building: settlement trough, tilt and damage potential according to the project's criteria – backed by floor plan and existing structure, documented ready for review.
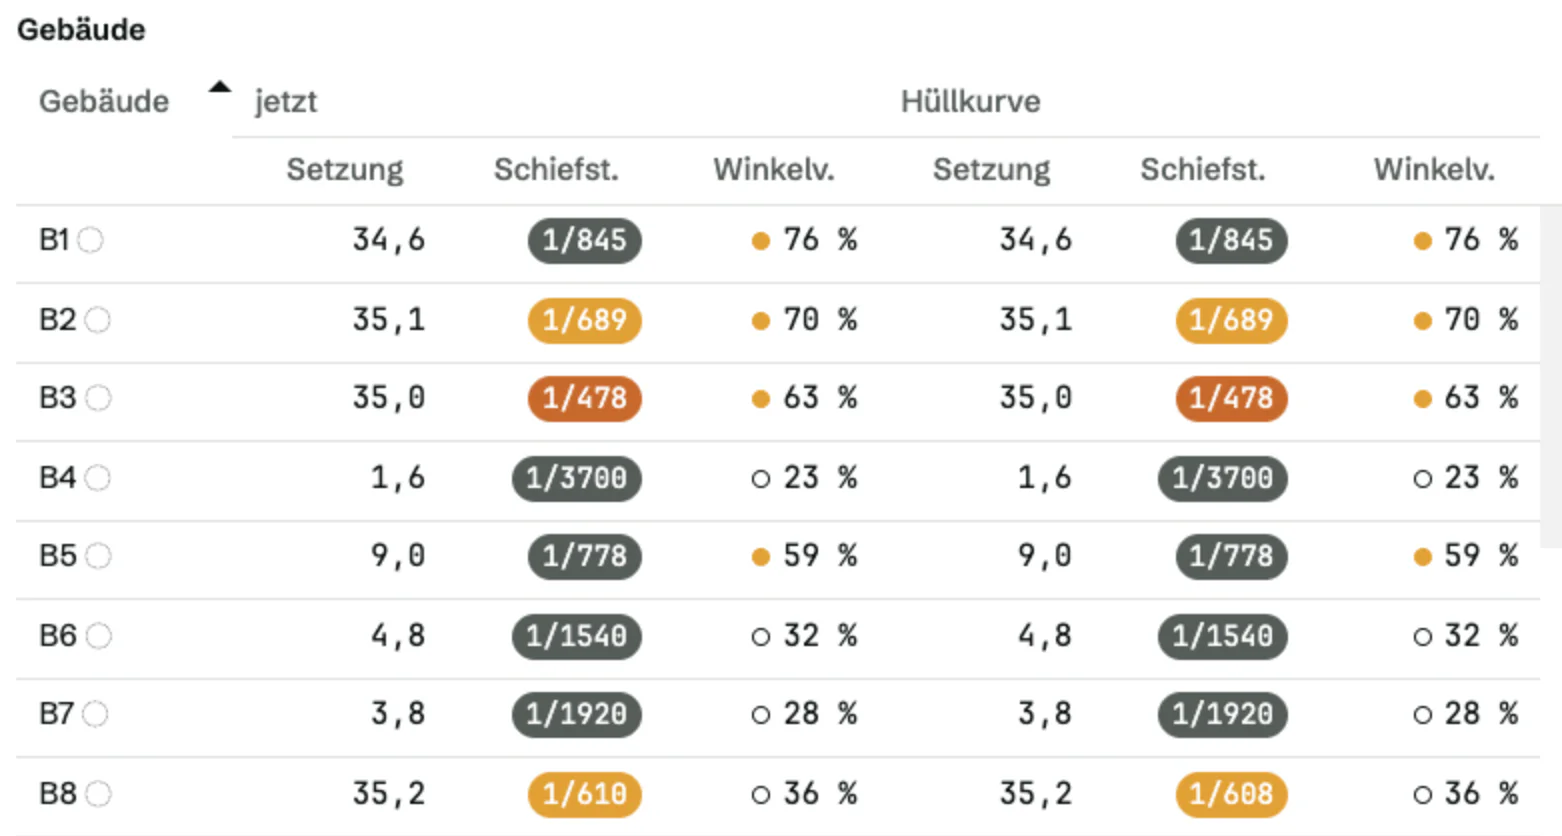
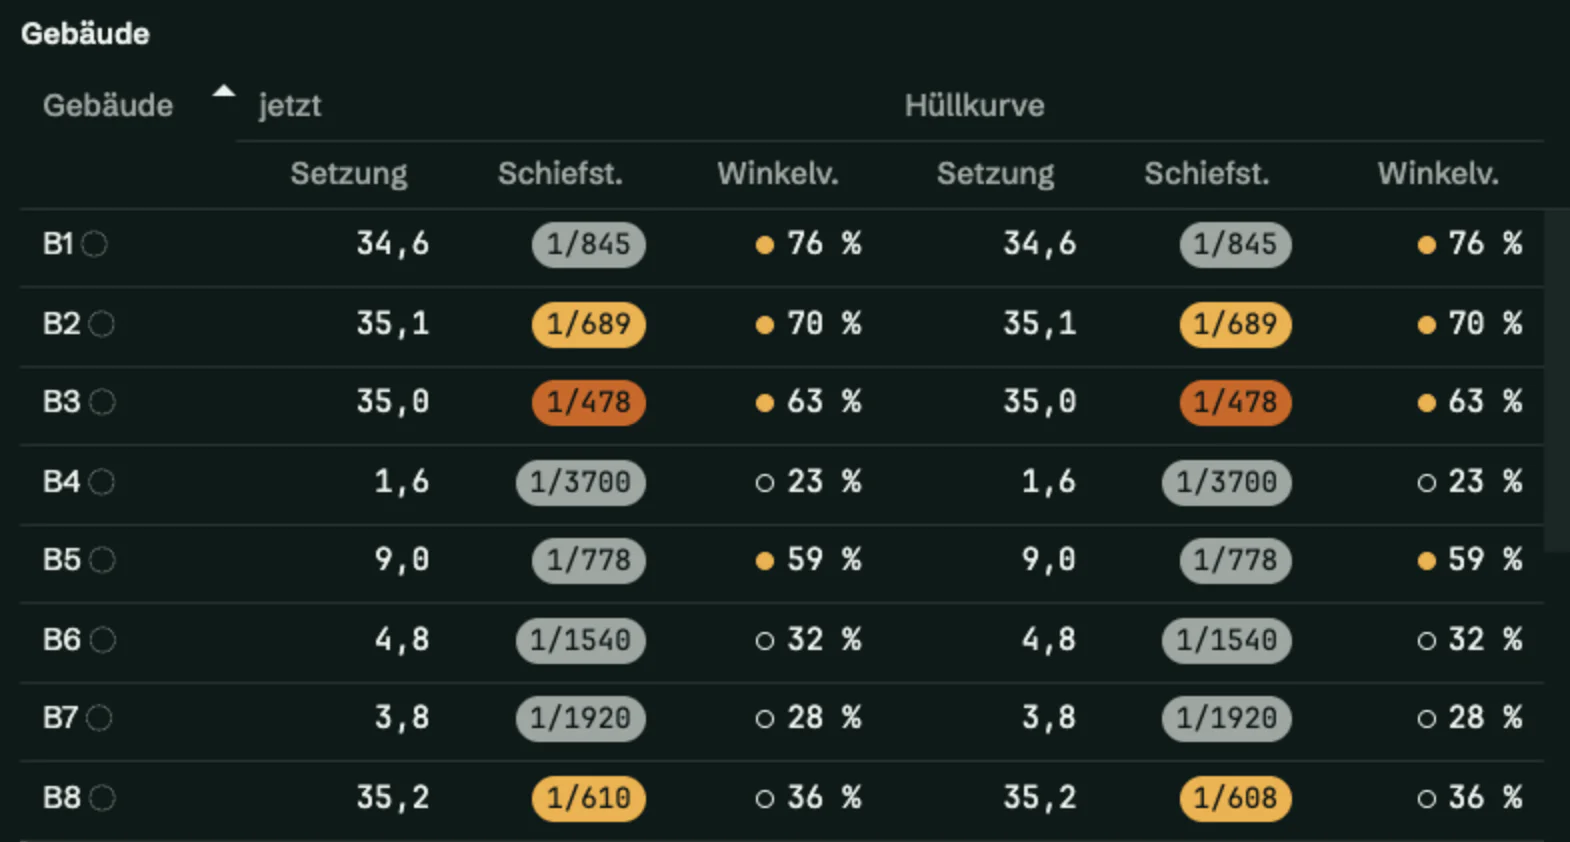
Demo project · synthetic model · buildings B1–B8 · envelope over construction time What happens if we change the construction sequence?
Order, advance rate, standstills – and their effect on forecast and existing structures, variant against variant.
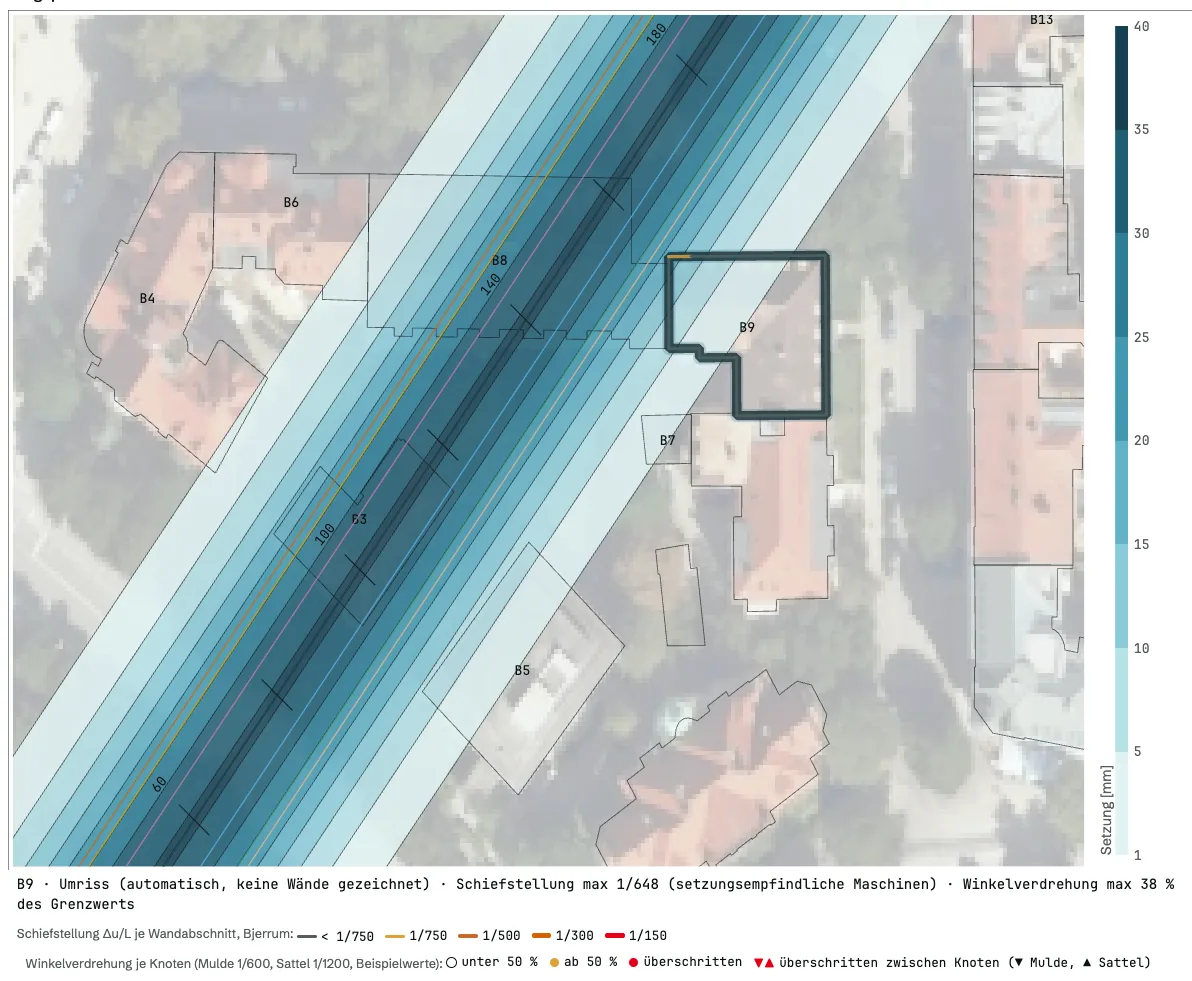
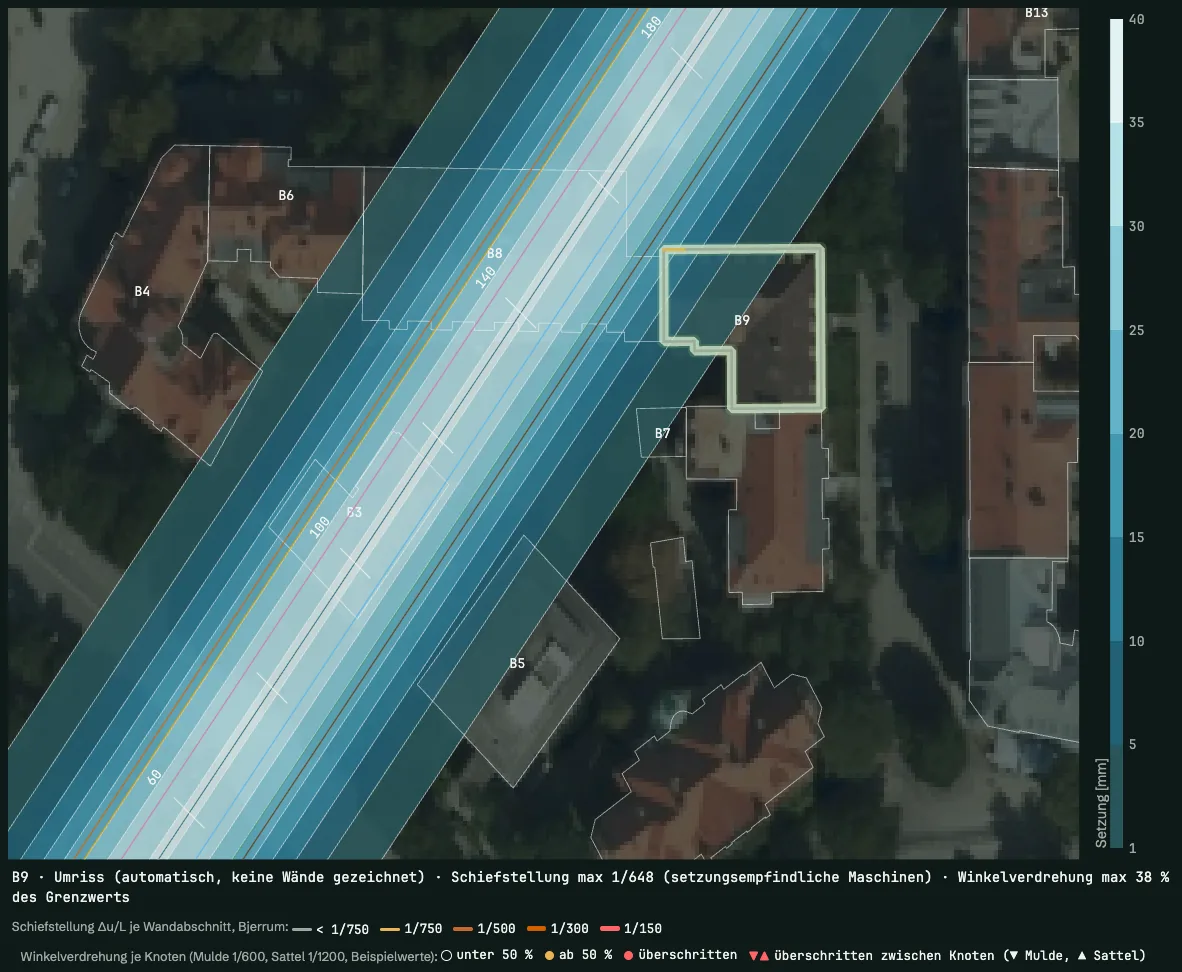
Demo project · synthetic model · B9 · max tilt 1/648 How do we update the forecast with the measurements?
in development
Readings, located in space, time and construction state, feed into the updating of the forecast.
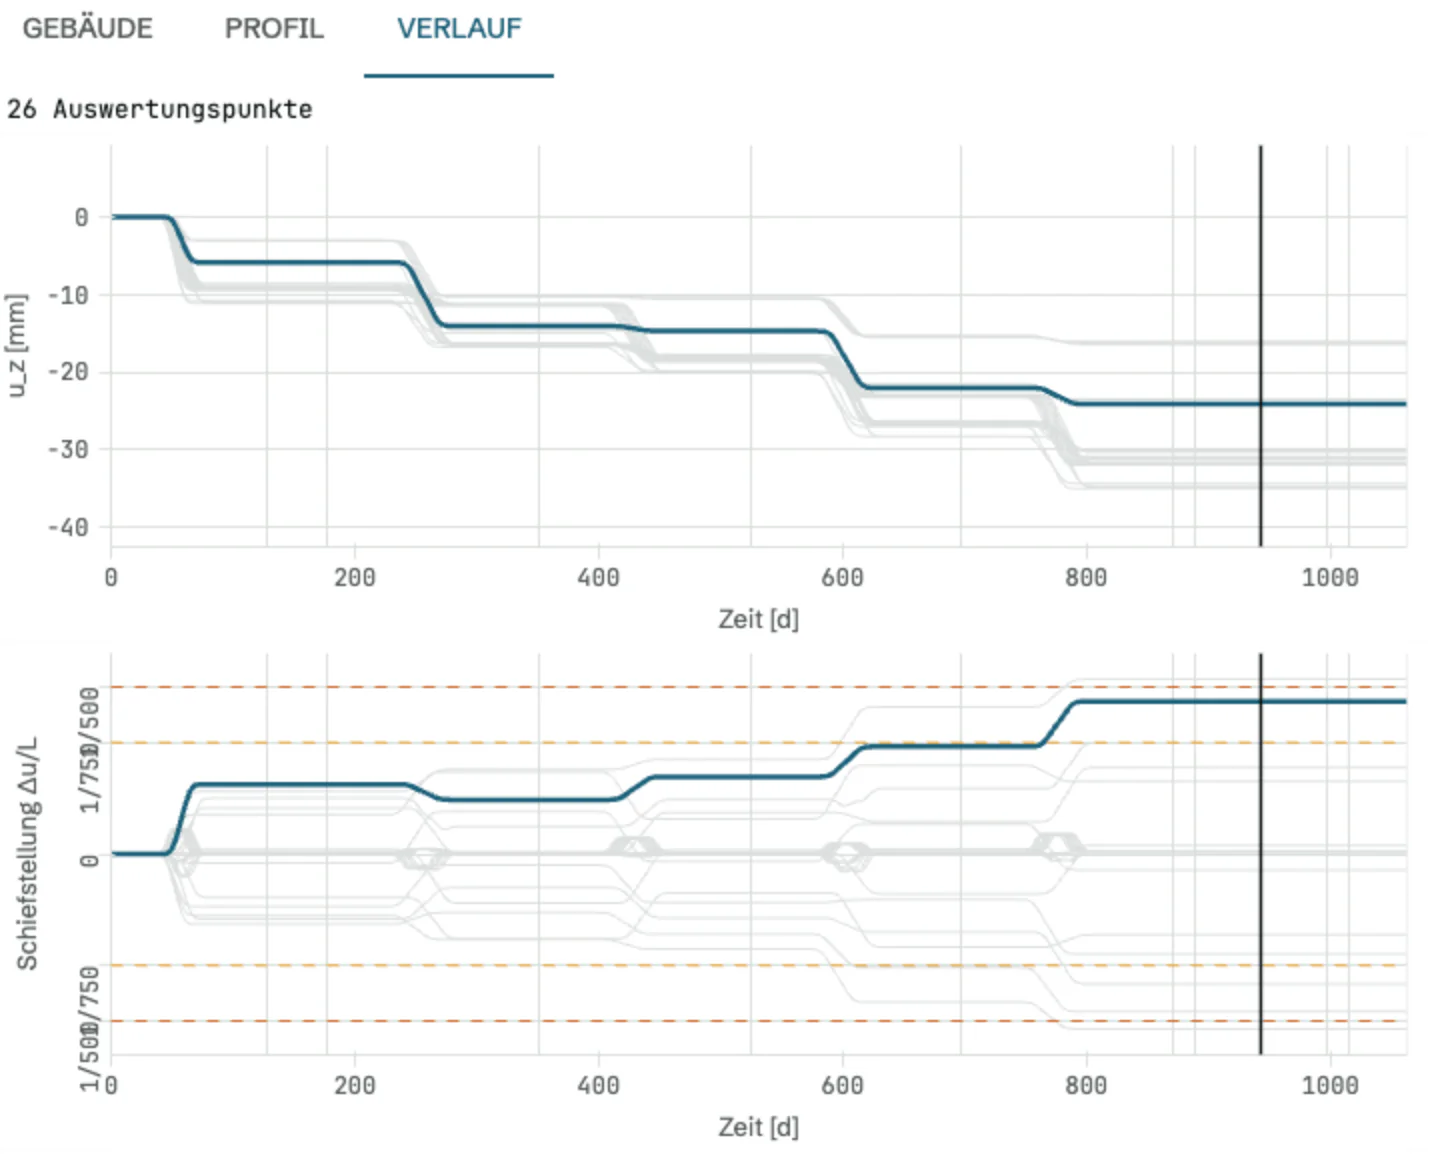
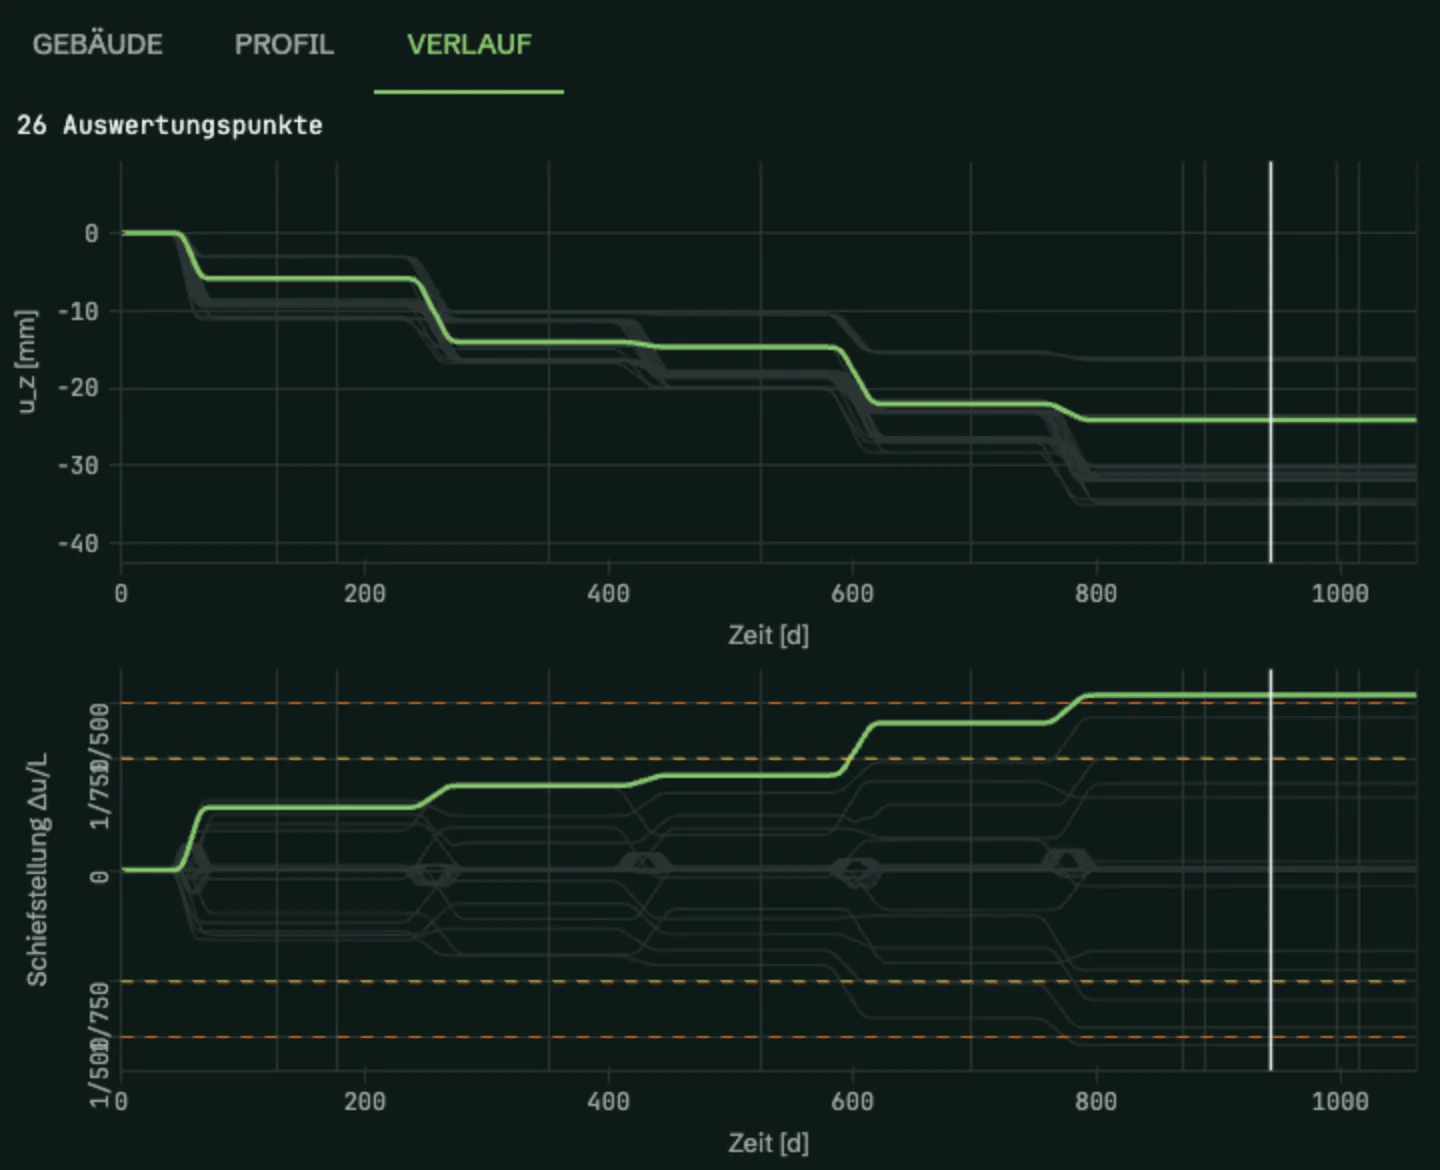
Demo project · synthetic model · 26 evaluation points · day 0 to 1063
Founded by an expert assessor for special foundation works, a professor of geotechnics and a developer of spatial analysis software.
How we work.
We are not building another view onto a model, but a model that holds the project together: forecast, construction sequence and existing structures in one frame of reference, every number with its provenance.
What the software does
- Integrate
Drawings, FEM results, schedule and measurement data become clearly defined, versioned datasets, organised by what they mean in the project.
- Compute, traceably
Every derived value knows its inputs, its method and its version, and can be recomputed and checked at any time.
- Analyse interactively
Plan, longitudinal section, time series and building assessment are linked.
Where we are heading
- 01Expect
A forecast for the next construction state, given as a range.
- 02Observe
Readings flow in, located in space, time and construction sequence.
- 03Compare
Measured and expected side by side – in the same model, in the same construction state.
- 04Update
The forecast is carried forward with reality; the view ahead stays current.
- 05Decide
The project team weighs consequences and options – on a documented basis.
The observational method of Eurocode 7 and SIA 267 as one continuous workflow. Today we deliver the forecast side; updating with measurements is in development.
Threshold values tell you that something is happening. The updated forecast tells you what follows. We complement monitoring; we do not replace it.
What we hold ourselves to.
Software that supports decisions in geotechnical engineering must stand up to scrutiny: in the design check, in the condition survey, in the claim.
Every number is explainable.
Every result can be traced back to the reading, the drawing or the FEM analysis it came from. The question “Why am I seeing this?” always has an answer.
Measurement is not prediction.
Measured, simulated, interpolated, assumed: values of different origin never look the same and are never mixed.
Uncertainty is information.
Forecasts appear with their range. Where data is missing, this is stated clearly.
Space and time belong together.
Every measurement knows its location, its moment and the construction state it was taken in. Only then can it be interpreted.
Every version stays on record.
What was known on the day of a decision stays reproducible, even years later. New insight is added as a new version.
The project team decides.
The software analyses and proposes. Where it automates, it shows its evidence.
Where the approach holds.
Two large inner-city infrastructure projects in Munich and Zurich: that is where we work today. The questions are the same wherever the ground is intervened in and existing structures stand nearby.
- Tunnelling
- Sprayed-concrete lining, shield tunnelling, compensation grouting.
- in use
- Excavation pits
- Inner-city excavation pits with condition surveys of the neighbouring buildings.
- transferable
- Foundations
- Deep foundations and underpinning next to existing structures.
- transferable
- Groundwater
- Dewatering and the deformations it causes in the surroundings.
- transferable
How we start
With the data as it exists in the project, and with the question that matters right now. We introduce GeoCubes in the project; after that the whole team works with it in the browser.
Project data stays with the project.
Hosted in the EU or in Switzerland, access only for the project team.
Who we are.
As consultants we looked for a tool like this ourselves and did not find one – so we are building it. Geotechnics, hands-on expertise in special foundation works and software engineering in one team.
Lars Künnemann
Co-founder · Product, engineering, sales
More than twenty years of special foundation works in inner-city settings: site management, grouting, branch and division leadership, and since 2022 consultant and expert for owners, designers and contractors. At GeoCubes he makes sure the software answers the questions actually asked on site – and brings it into the projects.
Matus Gasparik
Co-founder · Technology
From experimental research in engineering and the geosciences into software development: spatial data analysis, computer vision, interactive visualisation systems – at home where disciplines meet. At GeoCubes he is responsible for all of the technology – architecture, development, operations – and for the principle behind it: every result stays traceable to the data.
Ulrich Trunk
Co-founder · Geotechnics and grouting
Fifteen years of grouting at Keller Grundbau in design, execution and technical management; professor of geotechnics at the University of Applied Sciences and Arts Northwestern Switzerland since 2010, alongside expert work on large infrastructure projects. At GeoCubes he stands for the technical foundation.
Let's talk about your project.
Facing a demanding forecast of ground deformations, working on a complex geotechnical problem or evaluating extensive project data? Write to us – we reply promptly.